How our digital sustainability solution software helps industrial facilities meet new global reporting requirements
Across industries, organisations are under mounting pressure to deliver finance-grade sustainability reporting. With the International Sustainability Standards Board (ISSB) expected to announce its new Sustainability Disclosure Standards this year, a new global baseline for reporting will come into play. And, if organisations can’t comply, they may face stiff penalties.
While the Sustainability Disclosure Standards will not be mandated in every country, it’s predicted that most companies will voluntarily adopt them. Indeed, some are already taking proactive steps to report on sustainability metrics in response to community or investor pressure.
Yet reporting on sustainability measures can be difficult without the right digital tools. Until recently, 91% of organisations were unable to measure emissions comprehensively. Whether due to manual processes or a lack of integration across assets and sites, they have not been able to collect and make sense of the data needed to report on Scope 1, 2 and 3 emissions.
Given this challenge, there is an urgent need for new digital tools that make it easier to accurately and transparently track and report on emissions — particularly for complex industrial organisations. Industrial assets need a cloud-based, enterprise platform to perform and contextualise a granular mass and energy balance, and to track activity data throughout the industrial process down to a site, boundary and product level.
As the case studies below demonstrate, our digital sustainability software addresses this urgent need. The platform captures, analyses and reports on key sustainability indicators, enabling organisations to run near real-time analytics and produce granular, auditable reports that meet the latest regulatory requirements.
Case study 1: Our sustainbility software solves Scope 1 reporting requirements for an industrial asset
Scope 1 emissions are from sources that an organisation owns or controls directly. In this example, a smelter plant needed a better way to capture and report on emissions, as data was falling through the gaps.
Specifically, the facility was inaccurately recording SO2 and CO2 emissions — two critical metrics for sustainability reporting. With SO2, the facility had been erroneously using gas analysers that were not operating properly for large parts of the year. And, when it came to measuring CO2 emissions, they were over-reporting on emissions due to inaccuracies in the assumed utilisation when acids were neutralised by a limestone reagent.
By using our sustainability software and its digital twin solver, the smelter plant could quickly identify and rectify these errors, and make more timely and value-driven decisions around how to reduce emissions and meet regulatory requirements.
For example, the solver quickly demonstrated that the SO2 analysers weren’t working correctly, and that there was a large discrepancy between actual daily sulphuric acid production mass and what was being reported onsite. On average, the plant-measured (blue) results were 16.5% — or 350 tonnes of acid per day — lower than the model-calculated (red) results.
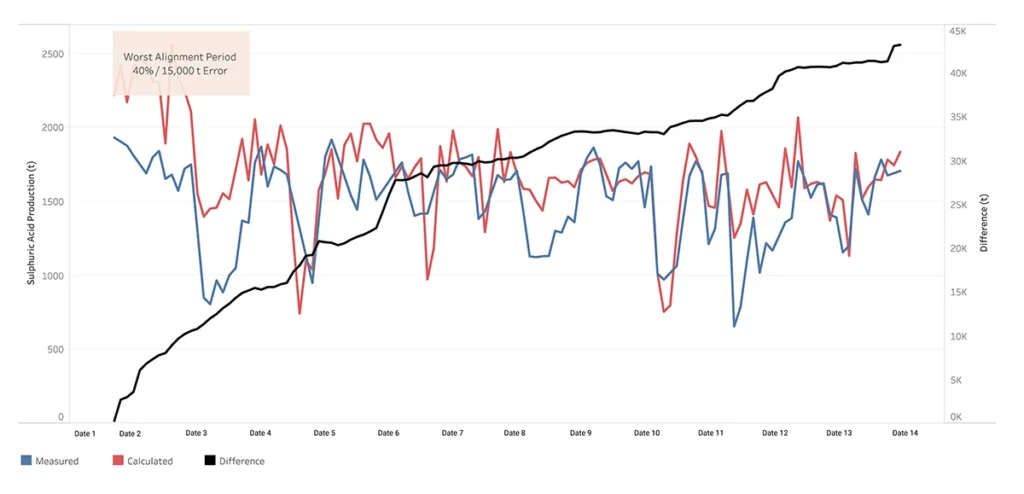
Over four months, this equated to 43,000 tonnes of unaccounted sulphuric acid, or an additional 26% of the plant-measured amount. In other words, the plant was underreporting Scope 1 greenhouse gas emissions through unrecorded SO2 gas losses. Armed with the insights from our sustainability software, the plant could accurately quantify losses and put plans in place to reduce them.
When it came to CO2 emissions, the plant used our sustainalbility software along side the measurement of volume and acid concentration up- and down-stream of the neutralant addition point. These direct measurements were fed into the digital twin dynamic model, which calculated the total mass of acid neutralised and reconciled measured values against other plant information. This granular detail ensured the Scope 1 CO2 emissions were calculated accurately — even if instruments failed or lab analyses were unreliable — which in turn meant the plant would no longer overreport on CO2 emissions.
Case study 2: Our sustainability software helps this industrial facility understand its Scope 2 emissions
Scope 2 emissions are those that a company causes indirectly when the energy it purchases and uses is produced. In this example, an industrial facility was struggling to reconcile energy consumption with production metrics.
Operators at the facility suspected that the fixed amount of power they pre-purchased wasn’t being used in its entirety. They thought that issues relating to poor current efficiencies within the electrowinning circuit were to blame, and they had spent a lot of time and resources trying to track down the source of these inefficiencies.
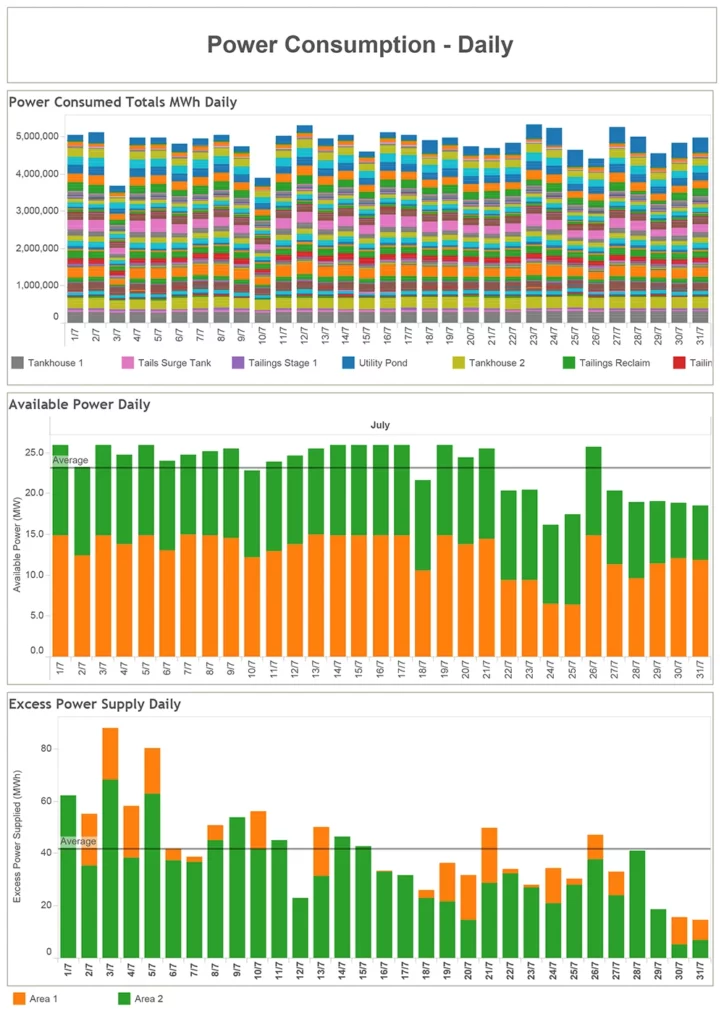
Only by implementing our sustainability software did the problem become clear. By obtaining plant instrumentation and power activity data from all aspects of the plant and incorporating it in a digital twin dynamic model, they gained a clear understanding of all aspects of plant operations, including energy consumption. They could also monitor power costs per area per day, and compare this against billed information.
The on-site team discovered that a large amount of power was not being utilised at electrowinning due to poor equipment reliability. On average, 42 MWh of excess electricity was purchased per day, adding up to US$1.5m per year of unused power. Armed with this information, they implemented projects to rectify the issues, increase production for the same operating costs, and optimise energy consumption. The result not only delivered cost efficiencies for the facility, but also improved scope 2 emissions per unit of production.
Case study 3: Deliver analytics to test and improve on Scope 3 emissions
Scope 3 emissions are those that are not produced by the company itself, but they are indirectly responsible for – up and down the supply chain. They can be poorly understood and hard to monitor, yet the global shift towards decarbonisation and reporting standards means it’s more important than ever to keep track of these emissions.
The key to understanding and lowering Scope 3 emissions is by obtaining a detailed breakdown of the different contributors, which means accessing a wide range of plant and business data, and combining it all into a single report.
In this example, an industrial asset used our sustainability solution to connect to numerous data sources — including plant instrument historians, production databases, and laboratory management systems — and feed them into a digital twin dynamic model. This allowed for the reconciliation of key measurements, giving stakeholders assurance the data was as accurate as possible and enabling the timely reporting of all scopes of carbon emissions.
Furthermore, with the digital twin in play, the organisation could test different scenarios to see how changes — such as to suppliers or reagents — could help reduce emissions. They could more easily identify key contributors to Scope 3 emissions, and compare alternative options.
Gaining an accurate, complete picture
As the examples above show, our sustainability software enables organisations to meet the latest reporting requirements by more accurately capturing, monitoring and reporting on Scope 1, 2 and 3 emissions. Not only that, but the simulations made possible by the digital twin provide invaluable insights that drive decision-making around reducing emissions, increasing productivity, and lowering costs.
To learn more about our sustainability software and how our team can help you satisfy evolving global compliance frameworks, get in touch.


